

Josh Aharonoff – CFO Excel Dashboard & Reporting
Josh Aharonoff – CFO Excel Dashboard & Reporting
Original price was: $499.00.$19.00Current price is: $19.00.
4.12 GB

After completing your purchase, you will receive a secure Mega.nz link to access your course materials. Follow these steps to access your course:


If you encounter any issues accessing the course via Mega.nz, please contact our support team, and we will provide you with an alternative Google Drive link.
Why Choose beastcourses?
- Permanent Access Links
- 24/7 Expert Support
- Instant Access to HD Quality Courses
- 100% Safe & Secure Checkout
- Courses Are Updated Regularly
Josh Aharonoff – CFO Excel Dashboard & Reporting

Josh Aharonoff – CFO Excel Dashboard & Reporting: The Ultimate Course for Financial Data Mastery
Dive into the world of financial data analysis and reporting with Josh Aharonoff – CFO of Excel Dashboard & Reporting. This comprehensive course, designed by financial expert Josh Aharonoff, is a detailed guide for professionals seeking to master Excel for financial reporting and dashboard creation.
Whether you’re a CFO, financial analyst, or business owner, this course provides the tools and knowledge necessary to transform raw data into insightful, actionable financial reports and dashboards.
Course Overview:
Josh Aharonoff’s CFO Excel Dashboard & Reporting course is structured to cover all aspects of financial data organization, reporting, and dashboard creation in Excel. It combines theoretical knowledge with practical application, ensuring that students not only understand the concepts but can also apply them in real-world scenarios.
What You Will Learn:
Intro & Getting Started: Begin with an introduction to the course and an overview of the essential technology stack needed for financial data analysis and reporting in Excel.
Organizing Your Data: Learn to create and manage tables, add contextual data, and use PowerQuery to transform raw data into a structured format suitable for analysis.
Creating Summarized Financials Report: Master the process of setting up financial reports, including Profit and loss statements, Balance Sheets, Cash Flows, and custom period reporting.
Understand how to measure period-over-period changes effectively.
Creating Dashboards: Dive into the art of dashboard creation, starting from preparing the data, building date selectors, and creating key performance indicators (KPIs). Learn to construct comprehensive KPI dashboards with dynamic graphs and spill arrays.
Budget vs Actuals Reporting: Develop skills in designing budget vs actual tables, creating gauge charts, and finalizing the design for clear and insightful reporting.
Management and Cash Out Dashboards: Create specialized dashboards, such as management reports and cash-out dashboards, essential for strategic decision-making.
Cover Page and PivotTable Dashboards: Learn to create a professional cover page in Excel and master the use of PivotTables and PivotCharts for dynamic dashboard creation.
Break Even and Spotlight Dashboards: Develop break-even analysis dashboards and spotlight dashboards for in-depth financial analysis.
Enroll Now:
Join Josh Aharonoff – CFO of Excel Dashboard & Reporting, and embark on a journey to mastering Excel for financial reporting and dashboard creation. This course is more than just an educational experience; it’s an investment in your professional development, equipping you with essential skills for success in the financial world.
Enroll today and elevate your financial reporting and analysis capabilities.

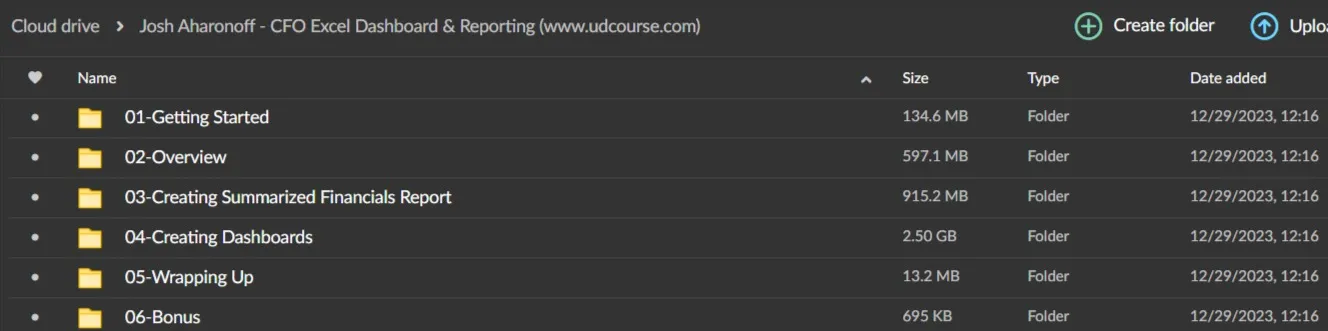
PROOF OF DOWLOAND
Other
Other Related Products