TraderSumo – Chart Reading Course
TraderSumo – Chart Reading Course
Original price was: $748.00.$13.00Current price is: $13.00.
1.25 GB

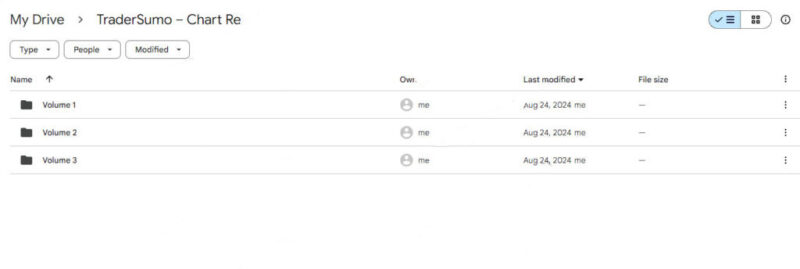
After completing your purchase, you will receive a secure Mega.nz link to access your course materials. Follow these steps to access your course:
If you encounter any issues accessing the course via Mega.nz, please contact our support team, and we will provide you with an alternative Google Drive link.
Why Choose beastcourses?
- Permanent Access Links
- 24/7 Expert Support
- Instant Access to HD Quality Courses
- 100% Safe & Secure Checkout
- Courses Are Updated Regularly
TraderSumo – Chart Reading Course

TraderSumo – Chart Reading Course: Master the Art of Technical Analysis
Are you ready to elevate your trading skills and unlock the secrets hidden in financial charts? The TraderSumo – Chart Reading Course is designed to equip traders with the skills to analyze financial charts effectively. Whether you’re a beginner eager to grasp the fundamentals or an experienced trader aiming to refine your chart-reading abilities, this course offers comprehensive insights into technical analysis.
By delving into the intricacies of chart patterns, indicators, and market psychology, this course provides a robust foundation for enhancing your trading strategies and decision-making processes.
Why Choose the TraderSumo – Chart Reading Course?
The TraderSumo – Chart Reading Course is not just another technical analysis program; it’s a meticulously crafted curriculum aimed at demystifying the complexities of chart reading. This course stands out by offering a step-by-step approach to understanding chart patterns and technical indicators, which are crucial for making informed trading decisions. With a focus on practical application and real-world examples, the course ensures that you gain theoretical knowledge and hands-on experience. Whether you’re trading stocks, forex, or cryptocurrencies, mastering these skills will significantly enhance your trading performance and confidence.
Key Learning Objectives of the Chart Reading Course
Understanding Chart Types
What types of charts will you learn about?
In the TraderSumo – Chart Reading Course, you’ll start by differentiating between various chart types, including line, bar, and candlestick charts. Each chart type serves a specific purpose and provides unique insights into market behavior. Line charts offer a simplified view of price movements over time, while bar and candlestick charts provide more detailed information about price fluctuations within a specific period.
How does understanding chart types benefit you?
Understanding when and how to use each chart type is crucial for analyzing financial data effectively. The course will teach you how to choose the appropriate chart type based on your trading strategy and objectives. This knowledge will enable you to interpret market trends more accurately and make well-informed trading decisions.
Identifying Chart Patterns
What are chart patterns and why are they important?
Chart patterns are formations created by the price movements of a financial instrument, and they play a significant role in technical analysis. Common patterns such as head and shoulders, double tops and bottoms, and triangles can signal potential market reversals or continuation trends. Recognizing these patterns allows traders to anticipate future price movements and adjust their strategies accordingly.
How will the course help you identify these patterns?
The course provides an in-depth analysis of key chart patterns, including how to spot them and interpret their implications. Through detailed explanations and real-world case studies, you’ll learn how to identify these patterns on your charts and understand their predictive value. This skill is essential for developing a successful trading strategy based on technical analysis.
Utilizing Technical Indicators
What technical indicators are covered in the course?
Technical indicators are tools used to analyze price data and generate trading signals. The TraderSumo – Chart Reading Course introduces you to essential indicators such as moving averages, Relative Strength Index (RSI), Moving Average Convergence Divergence (MACD), and Bollinger Bands. These indicators help traders assess market conditions and make informed decisions.
How can you apply these indicators to improve your trading?
The course will teach you how to apply these technical indicators effectively in various market scenarios. You’ll learn how to interpret the signals generated by these indicators and integrate them into your trading strategy. By understanding how each indicator works, you’ll be able to enhance your market analysis and make better trading decisions.
Trend Analysis
Why is trend analysis crucial for traders?
Trend analysis involves identifying and interpreting market trends to make informed trading decisions. Understanding the types of trends—primary, secondary, and minor—is essential for recognizing market movements and predicting future price changes. This knowledge allows traders to align their strategies with prevailing market trends.
How does the course cover trend analysis?
In the TraderSumo – Chart Reading Course, you’ll master the art of identifying trends and understanding their significance. The course provides techniques for analyzing trendlines, recognizing trend reversals, and using trend analysis to inform your trading strategy. This skill is vital for adapting to market conditions and optimizing trading performance.
Support and Resistance Levels
What are support and resistance levels and why are they important?
Support and resistance levels are fundamental concepts in technical analysis that indicate where the price of an asset tends to find a floor (support) or a ceiling (resistance). Identifying these levels helps traders understand potential price points where the market might reverse or stall, which is crucial for strategic trading decisions.
How will the course help you identify these levels?
The course teaches you to identify critical support and resistance levels on charts and understand their influence on price movements. You’ll learn strategies for trading around these levels, including how to use them to set entry and exit points. Hands-on practice with charting software will reinforce these concepts and improve your ability to trade effectively.
Volume Analysis
Why is volume analysis critical in trading?
Volume analysis involves examining trading volume to confirm or question price movements. High trading volume can indicate strong market interest and validate price trends, while low volume might suggest a lack of conviction. Understanding volume dynamics helps traders assess the strength of price movements and make informed decisions.
How does the course address volume analysis?
The TraderSumo: Chart Reading Course provides detailed instruction on analyzing trading volume and incorporating it into your trading strategy. You’ll learn how to interpret volume patterns and use this information to confirm price trends and signals. This analysis is crucial for enhancing your trading accuracy and effectiveness.
Course Structure
Introduction to Chart Reading
What will you learn in the introduction module?
The Introduction to Chart Reading module offers an overview of different chart types and their uses. You’ll learn the basic principles of technical analysis and how to interpret various chart formations. This foundational knowledge is essential for progressing to more advanced topics in the course.
How does this module prepare you for further learning?
By covering the fundamentals of chart reading, this module sets the stage for more detailed exploration of chart patterns, indicators, and analysis techniques. It ensures that you have a solid understanding of the basics before diving into more complex aspects of technical analysis.
Chart Patterns
What topics are covered in the Chart Patterns module?
The Chart Patterns module provides an in-depth analysis of common chart patterns, including head and shoulders, double tops and bottoms, and triangles. You’ll examine real-world examples and case studies to understand how these patterns form and what they signify for market movements.
How will this module enhance your chart-reading skills?
Through detailed explanations and practical exercises, this module will enhance your ability to recognize and interpret chart patterns. Mastery of these patterns is crucial for predicting market trends and making informed trading decisions based on technical analysis.
Technical Indicators
What will you learn about technical indicators?
The Technical Indicators module explores key indicators such as moving averages, RSI, MACD, and Bollinger Bands. You’ll gain a detailed understanding of how these indicators work and how to apply them in different market scenarios.
How does this module benefit your trading strategy?
By learning how to use technical indicators effectively, you’ll improve your ability to analyze market conditions and make strategic trading decisions. The practical application of these indicators will help you enhance your trading performance and accuracy.
Trend Analysis and Volume
What techniques are covered in this module?
The Trend Analysis and Volume module focuses on techniques for identifying trends and analyzing trading volume. You’ll learn how to recognize different types of trends and how to use volume analysis to validate price movements and signals.
How will these techniques impact your trading?
Mastering trend analysis and volume techniques will enable you to make more informed trading decisions and adapt to changing market conditions. This module provides practical exercises to reinforce your learning and build confidence in applying these techniques.
Support and Resistance
What strategies are taught in the Support and Resistance module?
The Support and Resistance module covers strategies for identifying and trading around support and resistance levels. You’ll learn how to use these levels to set entry and exit points and make strategic trading decisions based on price dynamics.
How does this module improve your trading effectiveness?
By understanding support and resistance levels, you’ll enhance your ability to anticipate price movements and optimize your trading strategy. Hands-on practice with charting software will further develop your skills in trading around these critical levels.
Conclusion
The TraderSumo – Chart Reading Course offers a comprehensive guide to mastering technical analysis and enhancing your trading skills. With a detailed curriculum covering chart types, patterns, indicators, trend analysis, support and resistance levels, and volume analysis, this course provides everything you need to read and interpret financial charts effectively.
Whether you’re a beginner looking to learn the basics or an experienced trader seeking to refine your skills, this course offers valuable insights and practical knowledge to improve your trading performance and confidence.
Enroll today and take the first step towards becoming a proficient trader with the expertise to navigate the complexities of the financial markets.


